CM Commerce Study: 8% of All Product Page Traffic Converts to Sales
In Ecommerce, one of the most crucial yet underappreciated hurdles to sales is driving visitors to click and view products. Unfortunately, the data reveals that, on average, Ecommerce stores have a 33.9% bounce rate. This suggests that approximately a third of all of the visitors that hit your homepage abandon the site without ever browsing through your inventory of products. On the bright side though, once a shopper clicks to view a product, you increase the likelihood of closing the sale.
Current Ecommerce Benchmarks
Around the web, numerous studies have been conducted to provide eTailers with estimates for average sitewide conversion rates.
- A Q1 2015 report by Monetate, for instance, states the global Ecommerce conversion rate is 2.32%.
- Bigcommerce corroborates Monetate’s assertion, suggesting that the most widely accepted average Ecommerce conversion rate is 2-3%.
- In Wolfgang Digital’s 2014 Ecommerce KPI Benchmarks study, Alan Coleman and his team analyzed 56 million visits across 30 participating sites to conclude that the average conversion rate among the stores they studied was 1.40%.
Yet, the research on product page conversion rates (PCR) is sparse. Without a definitive resource that could help Ecommerce brands set product page benchmarks, we, at CM Commerce, decided to commission our own study.
Tweetable takeaway: The research on product page conversion rates (PCR) is sparse, so @CMCommerce published this report: http://bit.ly/eCommPCR
Data & Methodology
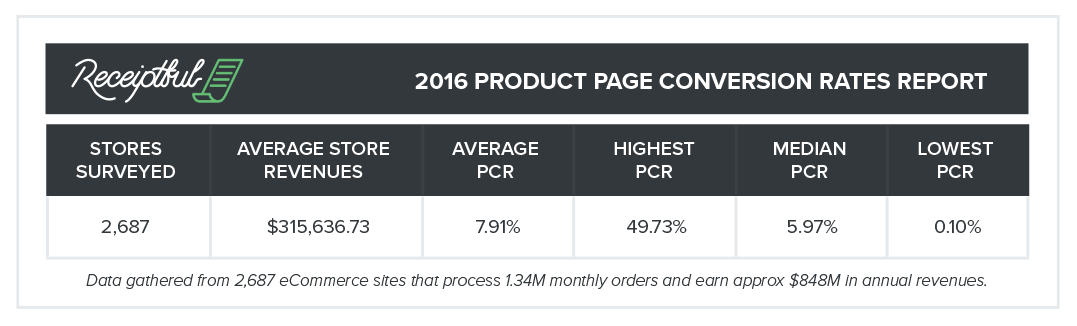
To produce our inaugural 2016 Product Page Conversion Rates Report, we gathered data from 2,687 Ecommerce sites* that use CM Commerce. In total, these sites send 1.34 million receipts** through the Conversio platform each month and they generate an estimated $848 million in annual sales. The average store surveyed sells approximately $315,600 worth of product every year.
Four major highlights from our study are:
- Among the 2,687 stores surveyed, the average PCR is 7.91%.
- Ecommerce “unicorns” convert nearly half (49.73%) of their product page traffic into sales.
- The median product conversion rate is 5.97% among our Ecommerce stores.
- At the low end of the spectrum, Ecommerce brands only convert 0.10% of the traffic that hits their product pages.
Tweetable takeaway: “Among 2,687 Ecommerce stores, the avg product conversion rate is 7.91%” http://bit.ly/eCommPCR via @cmcommerce
Of course, these numbers are meaningless absent context and segmentation.
Cross Tabulation: Store Sales & Product Conversion Rates
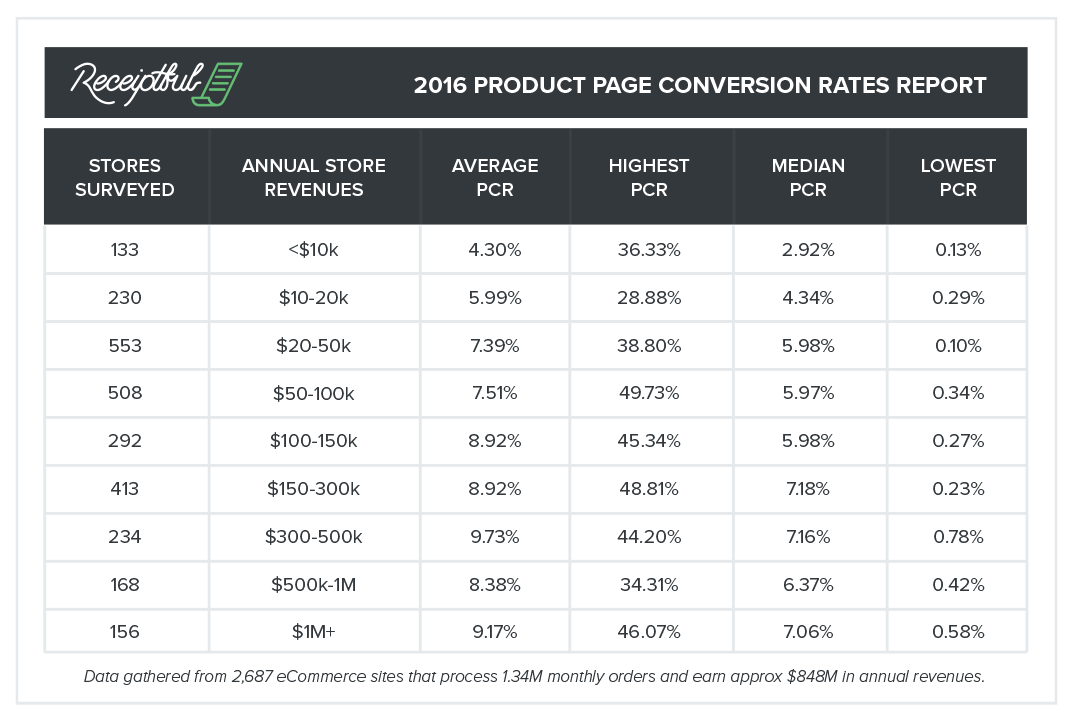
Good data is relative. To produce a report that Ecommerce brands of all sizes could use to improve their businesses, we took our research a step further. So, we segmented our stores by their annual revenues and calculated each group’s average, maximum, median, and minimum PCR. Rather than benchmark your website’s performance against the overall PCR average (7.91%), you can measure your success relative to your peers.
Here’s a summary of the data:
- Of the 2,687 online retailers we surveyed, 133 earn less than $10,000 in annual sales. These up-and-coming businesses have an average product page conversion rate of 4.30%. The unicorn in the group has a 36.33% PCR. The median PCR is 2.92%, and the store with the lowest conversion rates has a 0.13% PCR.
- Within our data set, we have 230 Ecommerce brands that generate between $10,000 and $20,000 in revenue each year. The average store in this group has a 5.99% product page conversion rate. The highest PCR recorded was 28.88%, the median 4.34% and the lowest 0.29%.
- From our survey, we found 553 stores that drive between $20,000 and $50,000 in sales every year. These eTailers have a 7.39% average product page conversion rate. The site with the highest conversion rates has a 38.80% PCR. The media PCR is 5.98%, and the lowest is 0.10%.
- The average product page conversion rate among the 508 brands that earn $50,000 to $100,000 annually is 7.51%. The highest PCR in this group is 49.73%, the median 5.97% and the lowest 0.34%.
- The 292 stores that generate $100,000 to $150,000 in annual sales have an average product page conversion rate of 8.92%, a high of 45.34%, a median PCR of 5.98%, and a low of 0.27%.
- O\ur report tracked 413 Ecommerce brands with annual sales ranging from $150,000 to $300,000 and found their average product page conversion rate is 8.92%. Their highest PCR is 48.81%, their median 7.18% and the lowest 0.23%.
- Of the 234 larger stores earning between $300,000 and $500,000 in sales every year, the highest product page conversion rate is 44.20%, the average 9.73%, the median 7.16%, and the lowest 0.78%.
- 168 of our bigger eTailers sell more than half a million ($500,000) worth of product every year, upwards to a cool million ($1,000,000). Among these stores, the average product page conversion rate is 8.38%. The highest is 34.31%, the median 6.37% and the lowest 0.42%.
- The 156 Ecommerce stores earning more than $1,000,000 a year have an average product page conversion rate of 9.17%. Within this group, the website with the highest conversion rate has a PCR of 46.07%. The median PCR among million-dollar eTailers is 7.06%, and the lowest is 0.58%.
Product Conversion Rate Trends: Identification & Analysis
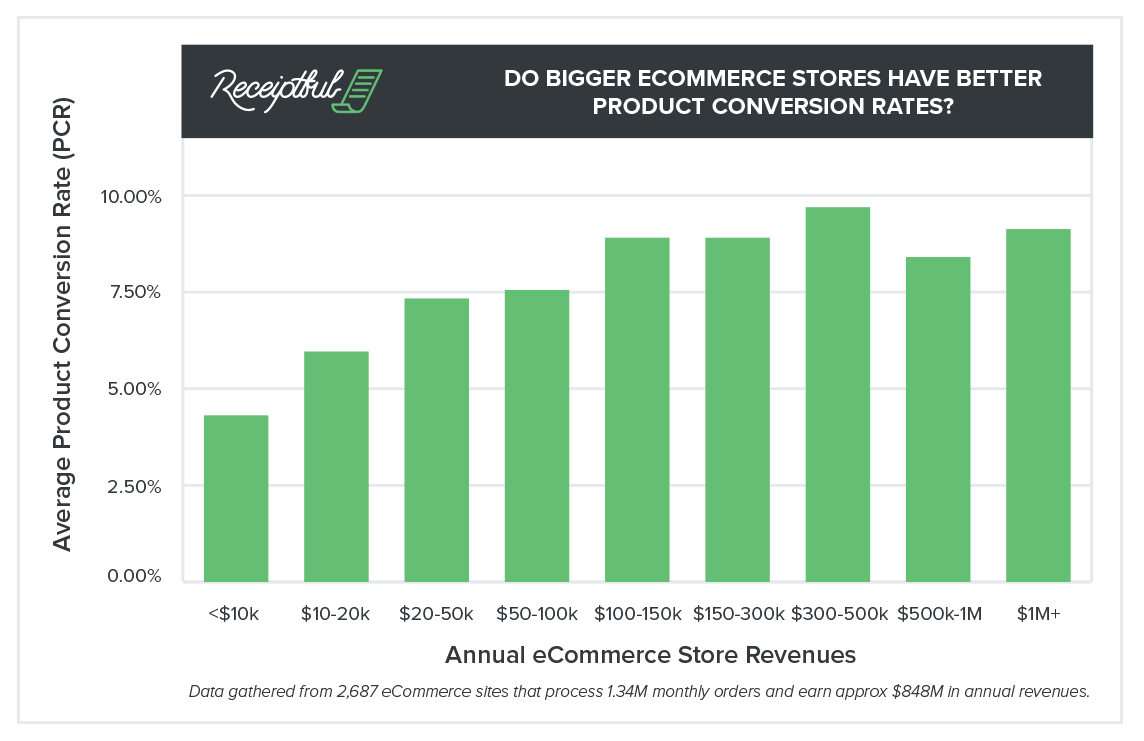
One noteworthy trend we noticed was a positive correlation between store revenues and product conversion rates. On average, Ecommerce brands with higher sales, up to $500,000 annually, had a better PCR than smaller-sized stores.
Tweetable takeaway: Ecommerce Benchmark Study: Stores that earn more, have higher conversion rates http://bit.ly/eCommPCR via @CMCommerce
But why is this so?
A broad explanation for this can be that larger stores have more resources to invest in optimizing their customer experience and conversion rates. Smaller brands, on the other hand, may not have many, if any, resources to invest in conversion rate optimization (CRO). Three supporting arguments for this theory are:
- With less than $20,000 in annual revenues, small brands might only be able to invest in expanding and optimizing zero to two marketing channels. Simply put, their cash limitations stymie growth.
- Ecommerce brands earning between $20,000 and $100,000 in sales each year are more likely to be able to afford the cost of initiating, managing and growing multiple marketing channels. Often, they have enough creative and technical resources to optimize their advertising efforts, customer experience and conversion funnel.
- Digital retailers with more than $100,000 in annual sales have bigger budgets to play with. These businesses have more established brands and have developed fully integrated marketing campaigns, marrying online (search engine optimization, display ads, affiliate marketing, partnerships) and offline (catalogs, direct mail, print ads) promotional tactics.
In Ecommerce, product conversion rates are a bit of a catch-22. You need money to optimize your conversion funnel, but with modest sales, you might not have excess cash or time to invest in growth. Instead, you may be more preoccupied with managing day-to-day operations. Of course, the good news is that one small tweak to your product pages can dramatically impact your PCR, which also leads to better performance for all of your other downstream metrics including sales. And that can be the catalyst for expanding your Ecommerce business from a part-time project to one that generates six-figures in annual revenue with enough cash to cover expenses and pay yourself a proper salary.
Tweetable takeaway: “Ecommerce conversion rates are a catch-22.” See the report by @CMCommerce here: http://bit.ly/eCommPCR
Closing thoughts
For the longest time, the only research Ecommerce store owners could find was focused on storewide conversion rates, and many of those studies failed to segment their findings according to store size. Now, CM Commerce’s 2016 Product Page Conversion Rates Report provides definitive data that helps businesses more accurately measure their product conversion rate against industry benchmarks and PCR averages seen by their peers.
Of course, our work is not done yet. We have not yet segmented our data by business category. When we do that, we will group our stores using 17 different categories ranging from automobile to arts & crafts, gardening & home improvement to fashion & apparel, and toys & games to travel & experiences. To get special access to that report and other upcoming studies, subscribe to new content from CM Commerce Academy below.
* CM Commerce sources data from its exclusive network of Ecommerce stores that utilize its customer engagement tools such as email receipts, product recommendations and abandoned cart emails. Our Ecommerce brands are diverse, spread across 17 different categories, and vary in size, with websites earning a few thousand dollars a year to some earning tens of millions.
** Receipts are a metric we use as a proxy for orders.